
daytradr V7.7B1 Beta Release: Auction Vista Gets a New Look
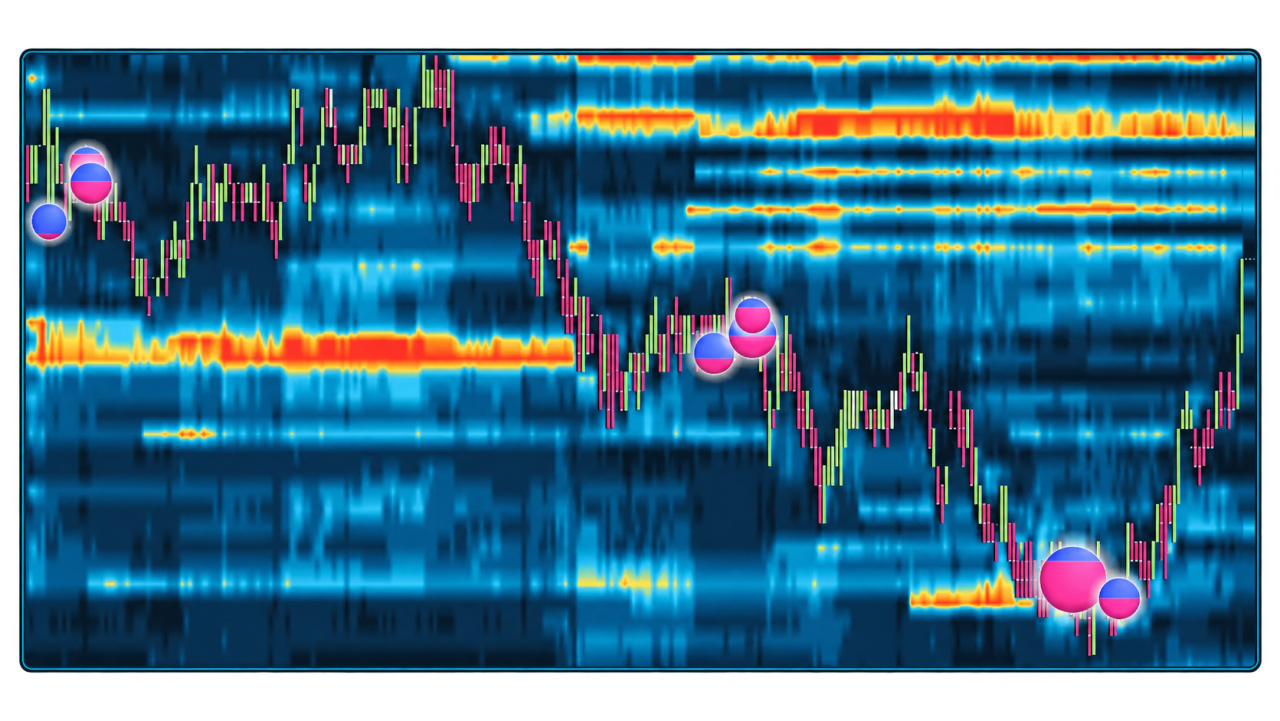
We've just released daytradr V7.7B1 Beta, with a completely redesigned Auction Vista heatmap. Looks way better, runs faster and uses less CPU. We've also kept what makes Auction Vista better from other heatmaps in the first place, how we identify significant trading activity.
If you've been using Auction Vista for a while, you'll notice the difference right away. The old version was starting to show its age. We wanted to improve the way liquidity and trading activity were displayed while making better use of your computer's resources.
And there's a reason for that. Most traders don't run just one chart. They've got DOMs, charts, news feeds and various other bits and pieces running. The last thing they need is heatmaps using more processing power than necessary.
A Better View of Liquidity and Trading Activity
The biggest visible change is the heatmap itself. We've updated the colours, improved the overall appearance, and made the trading activity circles much more prominent. The idea is to make it easier to see where liquidity is concentrated, where trades are taking place, and how price reacts around those areas.
Of course, a nicer-looking heatmap isn't going to make you a better trader. If that were the case, we'd all be profitable after buying a bigger monitor.
What matters is what the information tells you, and that's where Auction Vista has always taken a slightly different approach.
Those Circles Aren't What You Think They Are
Most traders are familiar with large-trade bubbles. A large market order hits a large limit order, a big circle appears, and everyone gets excited. Those genuinely large individual transactions are relatively rare.
There's nothing wrong with showing them, but there's a lot of trading activity that doesn't involve one enormous transaction. And some of that activity can be just as interesting, if not more so.
Auction Vista doesn't simply draw circles around individual large trades. It tracks trades at a price over time, which is a fundamentally different thing.
For example, suppose a market trades repeatedly at the same price. There might not be a single transaction large enough to qualify as a conventional large trade, but the total activity at that price could be considerable. Auction Vista is designed to pick up that activity rather than relying exclusively on the size of individual transactions.
Why does that matter? Because you should be interested in where people are actually doing business, not just where somebody happened to execute one particularly large order. If a lot of trading takes place at a price and the market struggles to move beyond it, that's potentially useful information. It doesn't automatically tell you to buy or sell, but it gives you something worth investigating.
We also account for changing market conditions when determining what constitutes unusual activity. A level of trading activity that would be completely normal just after the US open might be significant during a quiet lunchtime session. Using the same fixed threshold throughout the day doesn't make much sense to me.
This has always been part of the thinking behind Auction Vista. We don't want to fill the screen with circles simply because we can. We want to help traders identify activity that's worth paying attention to.
Better Performance, Less Work for Your CPU
We've also made improvements under the hood. Auction Vista now performs better while using less CPU, which is particularly useful when you're running several tools at once.
A heatmap has a fair bit of work to do. It has to process incoming market data, keep track of liquidity changes, and update what you're seeing on screen. When markets get busy, there's more information arriving and more work to be done.
We've worked on making that process more efficient. The intention is to give you a better experience without demanding more computing power. Especially when markets get busy.
Do You Really Need Another Trading Platform?
One of the things I've never particularly liked is the idea that traders need a collection of separate platforms to see different aspects of the same market.
One for the DOM, another for the heatmap, something else for analytics. Before long, you've got several subscriptions and a desktop that looks like an air traffic control centre. And that's before you factor in the cost of additional data feeds and logins to keep all those platforms running.
Auction Vista is part of daytradr. You already have access to a liquidity heatmap alongside our DOM and other order flow tools, without needing a separate heatmap subscription.
We've now improved the appearance and performance considerably. Add in the way Auction Vista tracks trading activity at price over time, and I think there's a strong argument for keeping your heatmap and order flow tools together.
daytradr V7.7B1 Beta Is Available Now
The new Auction Vista is included in daytradr V7.7B1 Beta. If you're an existing customer, I'd encourage you to give it a try, compare it with the previous version, and let us know what you think. Download it HERE
If you're not using daytradr yet, you can find out more about Auction Vista and the rest of the platform here: Discover daytradr
We'd love to hear your feedback!