
Trading without charts? Live volume profile analysis.
There’s often talk on trading forums about day trading without charts. The volume profile shows you where traders are positioned as well as which prices traded. A lot of information can be taken from the volume profile and we discussed this live as it was playing out.
This isn’t a debate about one method over the other, no “Charts vs Profile” here. I’ve had enough of those types of discussions on the forums! Just that you can analyze market information that’s not on a price chart. This can be done whether we have price charts open or not.
Anyway – what follows is the transcript from a Skype chat in the customer only Jigsaw Skype group. It’s free for customers and if you didn’t join yet – it’s worth a look.
[06:48:54] VM: guys could you please help…
[06:49:07] *** VM sent for peter1.png ***
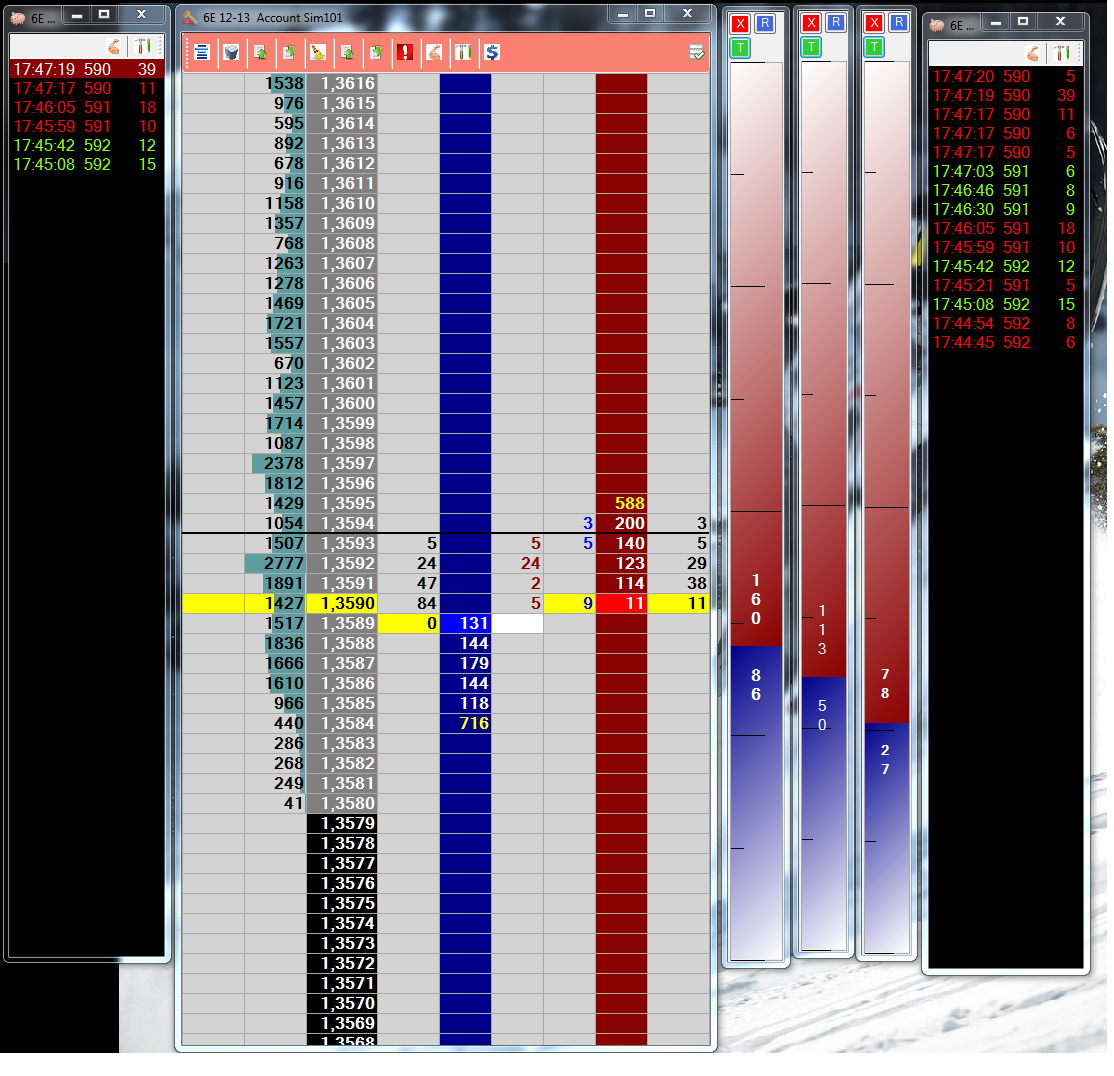
[06:49:27] VM: could you please tell using volume profile analysis where price may turn
[06:51:31] Peter Davies: I presume it’s been moving down, right?
[06:51:38] VM: yeah
[06:51:43] VM: i can show picture
[06:51:55] Peter Davies: no – don’t show a chart…
[06:52:23] Peter Davies: I’d be wary of it crossing back and forth over 1,3592 and building more volume there.
[06:52:48] Peter Davies: and if it does build a range, then I’d be looking to buy the top of the range, scale some @ the bottom of the range and hold for another push down
[06:53:22] Peter Davies: on the other hand if it pops up through 1,3597 I’d be looking for 3957 to hold for a move up
[06:53:53] VM: wow
[06:54:10] VM: great…. i didnt even thought about it 🙂
[06:55:07] Peter Davies: for the range, I’d look to see where it builds – it’s going to do so over time, I’d say 3602 is highest possible point for range high and as you say 3585 for range low but see what it does in terms of rotating around that 3592 area and see where volume builds
[06:56:19] Peter Davies: might not range of course – I’d see stops below 3585 – it’ll all depend on whether that 3592 level attracts price and we cross over it both ways
[06:56:35] Peter Davies: sorry if that’s too vague 😉
[06:56:43] VM: no no its really good
[06:57:29] VM: so important levels are 3585… possible line in the send.. also 3580 todays low.. 3592 possible rotation point… and 3597 -3602 highest points
[06:57:50] VM: so we could try to trade from lower border if i see buyers step in
[06:58:03] VM: and sell from upper border… or 3592 if i see sellers
[06:58:08] VM: did i get it right
[06:58:13] Peter Davies: yup – that’s the way I think about it
[06:59:40] VM: so if i see that price has no power to go above 3592… after sometime we may see push down
[07:01:44] Peter Davies: absolutely
[07:01:51] Peter Davies: and stops below 85
[07:02:03] Peter Davies: so it should accelerate @ that point or one close below
[07:02:39] VM: yeah now we got to 86 traded there only 9 lots… and pushed up to 91
[07:03:33] VM: Peter… why 94 level is not good and you expect 3602 as possible upper point?
[07:03:44] VM: because i thought range might be 94 85…
[07:05:27] VM: ooohhhh you are so right.. they printed zero lots at 92.. and fall down again and at 85 now
[07:07:03] Peter Davies: it’s a slippy market – and I see that 2378 @ 3597 above and I think about the potential of that area in the middle filling in and making it part of the range
[07:07:27] Peter Davies: they’ll probably have another shot @ it
[07:07:53] VM: they fall to 82… i see some lots sold there… but then huge buyers came in
[07:07:57] VM: and now 87
[07:08:35] VM: [07:06] Peter Davies:
<<< it’s a slippy market – and I see that 2378 @ 3597 above2378 means?
[07:09:02] VM: ahh lots
[07:09:09] Peter Davies: sorry – 2378 is the volume printed @ 3597
[07:09:29] VM: yeah understand 🙂
[07:10:35] VM: really nice! never thought about it like that
[07:10:43] VM: no we again moving to 92
[07:11:25] Peter Davies: just think about the fact people are positioned @ those levels and think about what it means to them if we move through OR if we start to rotate and build more volume htere
[07:13:21] VM: if they see it as a range.. then they may put sl above 3602 and below 3585…. but if they see direction move.. then they put SL above prev high i guess
[07:13:29] VM: or 92
[07:13:41] VM: as a possible well protected point
[07:14:15] Peter Davies: on the ES – when it starts building volume, it’ll spin around it and scalpers are all over that sort of action
[07:18:32] VM: you a wizard
[07:18:37] VM: 3599
[07:18:52] VM: and they build up that range from 3593 to 3597
[07:19:59] VM: Damn where can i learn about that kind of analysis
[07:20:53] Peter Davies: I just told you!
[07:20:56] Peter Davies: lol
[07:21:01] VM: hehe
[07:21:12] VM: yeah now i understand
[07:21:18] VM: range analysis
[07:21:26] VM: and when we see directional move?
[07:21:50] VM: should i expect VPOC 3592 as possible level to buy to move up again to upper border?
[07:22:08] VM: sorry for so many questions… but it is very usefull info!
[07:24:47] VM: haha we got to 3602 and failed to mov ehigher…. i see huge absorption of buyers at 3599 and then fading buyers at 3600 01 and only 19 lots at 02
[07:25:12] Peter Davies: got another pic?
[07:25:18] VM: yeh
[07:25:20] VM: preparing it
[07:25:21] VM: in a sec
[07:26:05] *** VM sent for peter2.png ***
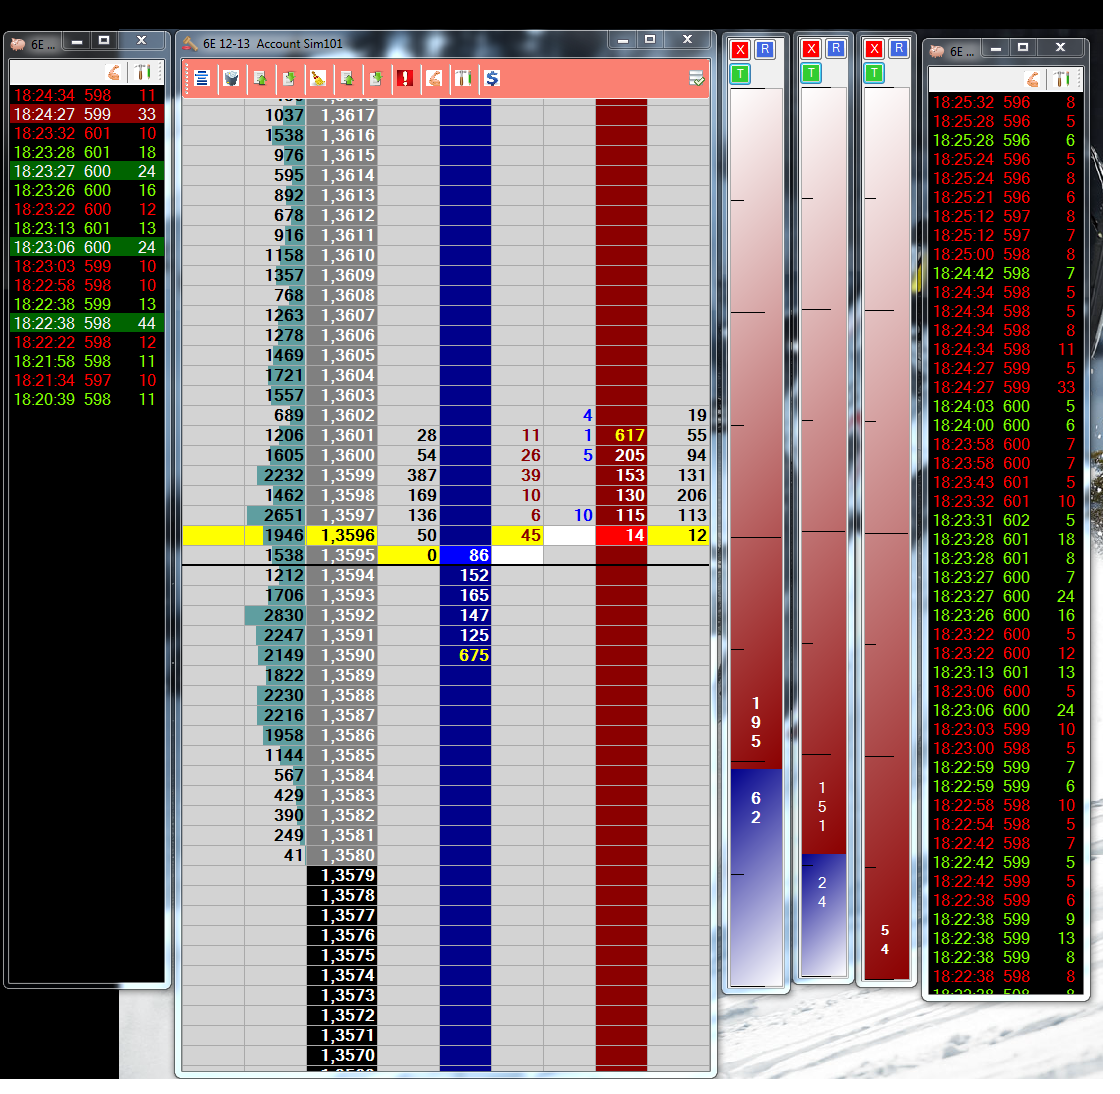
[07:26:51] VM: it looks like it is a range with 2 rotating points
[07:31:30] Peter Davies: a lot of people will fade this range – it is normal to rotate around a range like this on ES 4-5 times – then it’ll break and when it does, you’ll get some acceleration as one side gets stopped out
[07:32:54] VM: So moving around 2 points… is normal ranging?
[07:33:07] VM: we move up… rotate there.. then fall down and rotate at 92…
[07:33:09] VM: then again
[07:33:15] VM: after that we have many lots
[07:33:24] VM: and many stops above and below
[07:33:44] VM: and then we hit stops… and bammm price moves very very fast
[07:39:19] TF: Vitaly , you will see the range build in the volume profile , and it will often eexpand as it is stopping out out traders on each side before it breaks
[07:40:21] Peter Davies: Vitaly – quite normal on the ES for sure – but it’s all auction behaviour – temporary value before moving off elsewhere – usually in the original direction – so my bet would be on a downside break
[07:40:43] Peter Davies: of course I haven’t looked @ a chart, so if the low is a key level this could be the launch pad for a reversal
[07:41:29] TF: The original direction is quite logic, as if you are moving down there is not many longs left (as Peter has said many times), but it is not written in stone 🙂
[07:42:00] Peter Davies: well – move down, accept lower prices (range), then carry on down ’cause you accepted lower prices.
[07:46:55] VM: 6E is in a global range of 100 ticks
[07:47:01] VM: so we are at upper part of that range
[07:47:05] VM: so i guess we go down
[07:47:09] VM: after that range
[07:49:24] Peter Davies: so like I said – for me – in this scenario – I sell near the top of the range – scale some @ the bottom & then try to hold for a breakdown – just need to get in early on – not the 10th hit of the extreme
[07:49:45] VM: okay so far price did move up and down 4-5 times so far…. 3 times on news… that we had 4 mins ago
[07:50:36] VM: Peter and lets assume that we have a directional move…
[07:50:44] VM: volume profile may help somehow?
[07:51:30] DTP: hi everybody
[07:51:38] VM: hi DTP!
[07:51:40] Peter Davies: well – you know where the extremes but you knew where they were likely to be just based on the profile – what more do you need right now in terms of getting positioned?
[07:52:10] DTP: hi vitaly
[07:56:06] VM: Okey peter, how did you know that 3602 will stop them… cos they still maybe possible to move to 3606… or i am wrong?
[07:56:58] VM: 3602 is 689 lots and 3603 1550.. seems not a big diff.. or it iis very big?
[07:57:29] VM: maybe you have a rule.. how to identify that this area is for sure will be border…
[07:57:41] VM: like because it is 3-4 times smaller then levels close to it
[08:02:24] Peter Davies: no rules – just eyeballing it
[08:03:01] Peter Davies: watch it for a few weeks – you’ll get it – this is discretionary analysis – more like a finger in the wind. It’s not difficult, just don’t look for hard rules
[08:03:10] Peter Davies: they may exist – just I don’t have them
[08:04:44] VM: THanks Really very interesting…. 1 more question… does support becomes possible resistance
[08:04:47] VM: or its a fake
[08:05:52] Peter Davies: no – that happens all the time
[08:07:12] VM: so its not a fake… and usually it is like that… people protect levels that were broken
[08:08:03] VM: cos some people say it works. some say no.. dont know who to believe…
[08:08:59] Peter Davies: nothing always works but those are levels that people watch – but also they often are places where we broke out from high volume and we can’t penetrate back into that high volume ’cause it gets defended
[08:09:08] VM: on trend move usually previously broken level becomes a place to which level might happen pullback and so i can enter from it in trend direction
[08:09:32] VM: yeah understand now
[08:19:03] Peter Davies: Once you have your eyes opened to watching where the volume is on the profile and you watch it – it’ll start to make sense
[08:19:41] VM: yeahh stop run on 6E we fall below 83
[08:19:43] VM: and now 73
[08:19:46] VM: with acceleration
[08:22:36] DTP: http://screencast.com/t/mc7hMMtG
[08:23:20] VM: yeah i see the same DTP
[08:23:27] VM: where do you expect they start to sell
[08:23:30] VM: or to enter in sell
[08:23:55] VM: 82-83?
[08:24:15] cpbritton: DTP, what footprint chart are you using?
[08:24:22] DTP: red area is sell directional point, stop little inside of balanced action, look the volume supporting the break
[08:24:33] DTP: gomi
[08:24:43] cpbritton: from BMT? (GOMI Ladder)
[08:24:47] DTP: yes
[08:24:50] CPB: thanks
[08:24:54] Peter Davies: can you post another screen shot Vitaly?
[08:25:45] VM: yeah
[08:25:46] VM: sec
[08:25:46] VM: sure
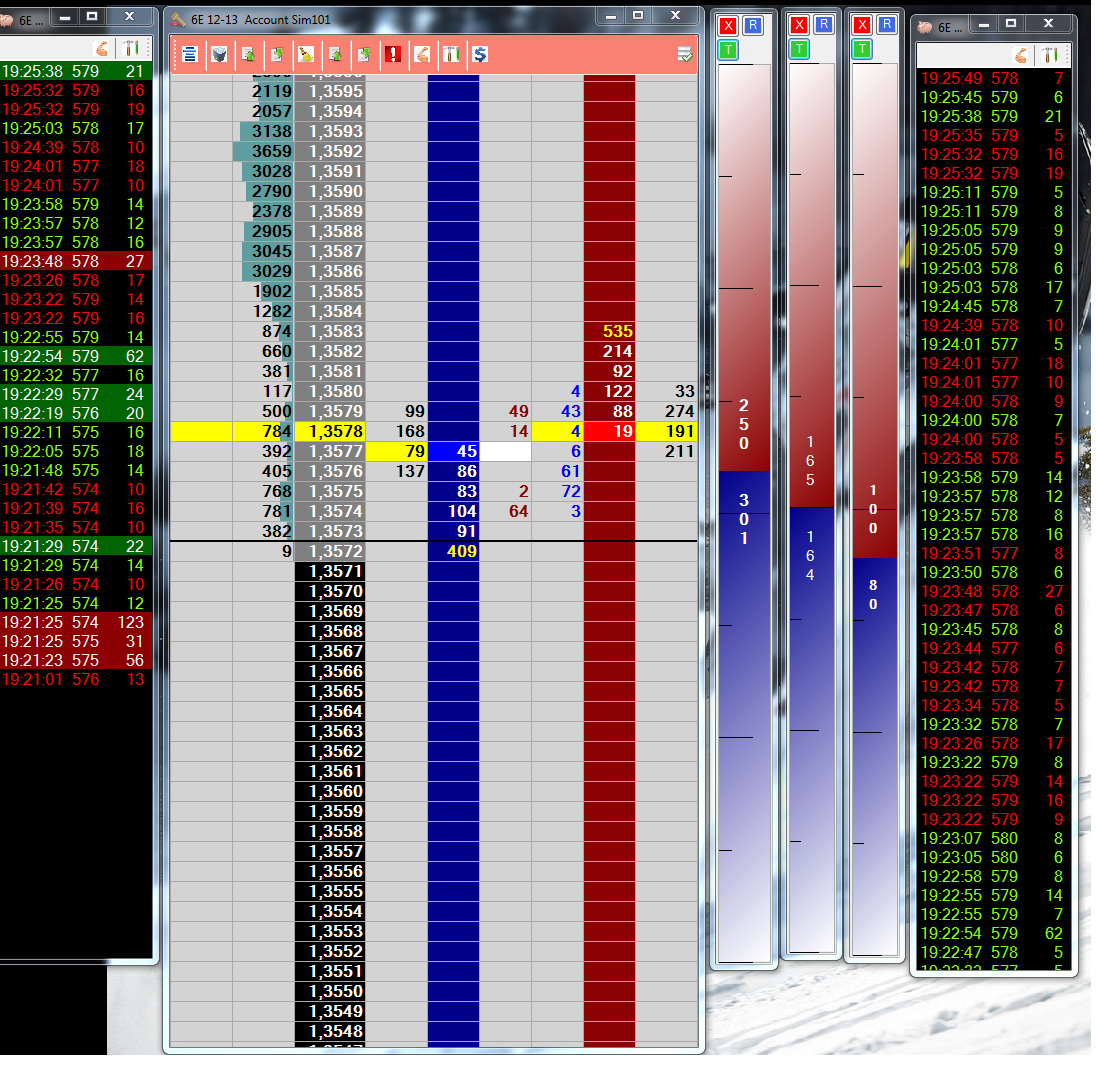
[08:26:20] *** VM sent for peter3.png ***
[08:26:37] DTPnews in 4 minuts
[08:27:53] Peter Davies: ok – so I presume it accelerated when 85/84 broke,right? You can see low vol on the profile…
[08:28:15] VM: yeah
[08:28:25] VM: was very fast move to down side
[08:28:46] Peter Davies: sure cause all the longs in that range got stopped out
[08:29:11] Peter Davies: so now, for downside, it should stay below 84/85 again – where that volume is
[08:29:29] Peter Davies: if it goes back up there, it’ll move through sluggishly
[08:29:45] VM: cos sellers will be stopped out
[08:29:56] VM: the ones that sold when price broke to down side
[08:30:10] Peter Davies: well – sellers probbaly won’t stop out right away – no real need for them to be too nervous- just if it goes back, it’ll likely churn as it’s an area of price acceptance
[08:30:17] VM: aaaaa
[08:30:18] VM: news!
[08:30:27] VM: +28 ticks i got from sell
[08:30:48] Peter Davies: nicely done! 28 ticks is a nice trade.
[08:31:08] VM: let me post a picture
[08:31:12] Peter Davies: ok
[08:31:53] *** VM sent for peter4.png ***
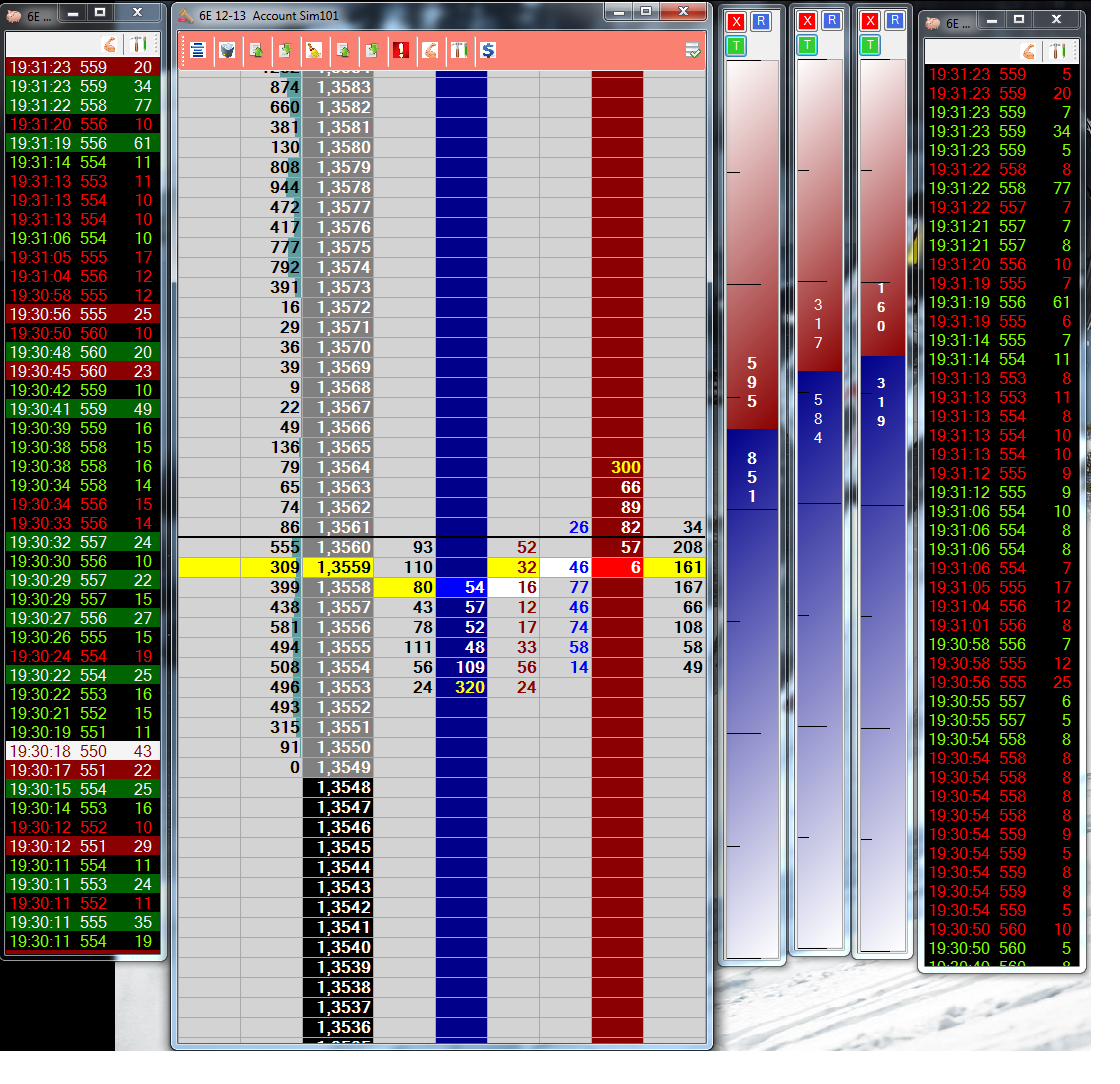 [08:32:40] Peter Davies: lovely
[08:32:49] Peter Davies: that off the news too?
[08:32:56] VM: yeah
[08:33:08] VM: market was very thin
[08:33:08] VM: and
[08:33:18] VM: this is what has happened
[08:33:27] Peter Davies: cool – so you got into a trade with defined risk, get some breathing room into the news and you were safe to let it run into the news. Great trade
[08:33:38] VM: now they again building volume… not huge so far…
[08:34:02] VM: thx Peter!
[08:34:07] VM: it was really nice trade…
[08:34:11] Peter Davies: New area – sometimes better to let it build out.
[08:34:19] Peter Davies: No problem Vitaly – you took the trade!
[08:34:57] *** VM sent for peter5.png ***
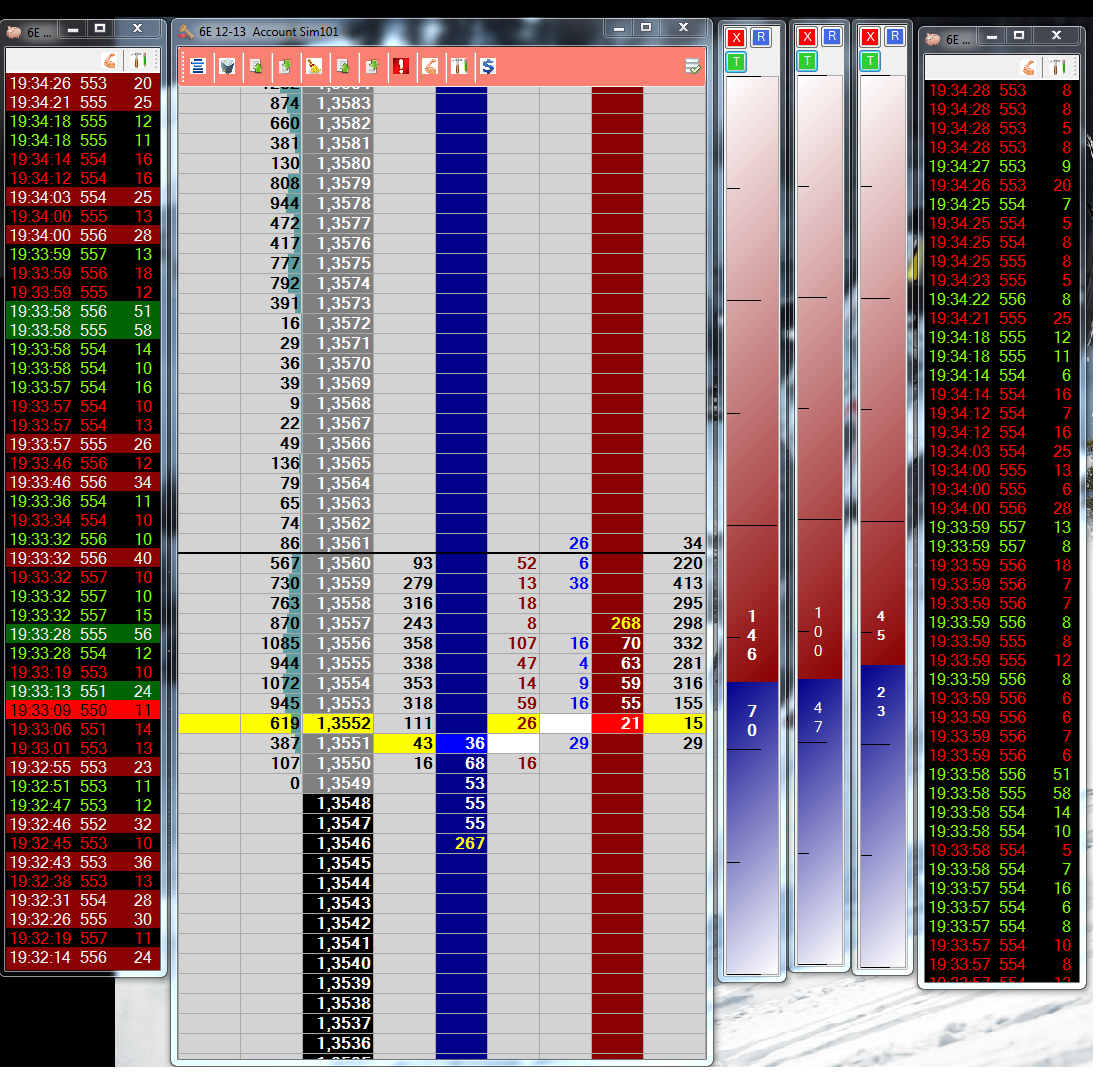
[08:35:06] VM: this is how it looks right now …another possible range
[08:35:58] CPB: nice work!
So whilst we didn’t discard the charts, we did discus trading without charts up at all. We were just looking at the markets from a volume profile perspective.
It’s a skill worth developing.
FREE BONUS: Take a look into the decision-making process of professional traders with this video training series that helps you make smarter trading decisions.


0 Comments