Lesson 5 – Summary Tape
This lesson gives insights into applying the Summary Tape information in real time. This includes what you should be looking for and how to interpret the data on there. Note that the more I use the summary tape, the less I use the charts. Still, I have not gone into trading solely off the summary tape, more it’s use to confirm/refine entries.
Video – Detailed explanation of the Summary Tape
This first video explains what you are actually seeing on the Summary Tape, what higher number of contracts at bid/offer really means and why Cumulative Delta is important.
Using the Summary Tape
The summary tape is not intended to be a ‘snapshot tool’. By that I mean you should not expect to be able to glance at Summary tape and immediately tell if the market will go up or down. The summary tape is about seeing changes over time.
When I open the summary tape window, I first take 2 or 3 minutes to acclimatize. By this I mean that it takes me a few minutes from first looking at the screen to get myself focused and to the point where I have a ‘feel’ for what’s happening. This is partly getting myself to the point where I am concentrating and partly getting a feel for where the market is.
If you are looking to use Summary Tape to refine/confirm entries, then my recommendation is to set an alert close to the entry point but not so close that it only gives you a few seconds to digest what is on the Summary tape. This will vary by market. it may be 4 ticks on the ES but 15 ticks on the CL.
As I mentioned, this is about changes over time. We might for instance be in a pullback in an uptrend. At the time, it won’t necessarily be clear if this is a pullback or a reversal. If we had watched the market on the way up, observed the move in delta, the strength in the move up, we could to use this as reference in the pullback.
As the market pulls back, we will observe certain behaviors. We will see size to tick down through each level, we will see the mix of buyers & sellers, we will see the speed of up & down moves. This is the rhythm of the market. At some point, we will see a change in the behavior. It is this change in behavior that gives the tape reader a signal long before anything is apparent on a chart.
In terms of the types of behaviors you can look for, markets tend to reverse up in one of the following ways:
- Market can ‘thicken up’ – the amount of trades to go down through each level steadily increases. An aggressive trader could go long at this point, a less aggressive trader could wait for the sellers to realize what is happening and for them to stop selling.
- We can run out of sellers. This often happens in an exhaustive/capitulative move. We see a large volume of ‘excited’ sellers jump into the market, often combined with bidders thinning out. At some point, we simply run out of sellers, everyone that wants to sell has sold. The liquidity providers now have long positions and it doesn’t take much to get people to jump on a move back up, including of course, those poor sellers who joined at the end.
- The market can just make a lazy turn without much fanfare or sign at all. A gradual move from selling to buying.
- Buyers jump in from nowhere in huge size.
For me, I find the ‘thicken up’ scenarios easiest to trade on the ES. I just pass on the others. Everybody is different and some people may find other types of moves easier to read. This is why replaying the Summary Tape over your entries is key to understanding what YOU will get from the tape as opposed to what I get from it.
Your trading is about what YOU can see in the markets that suit YOU.
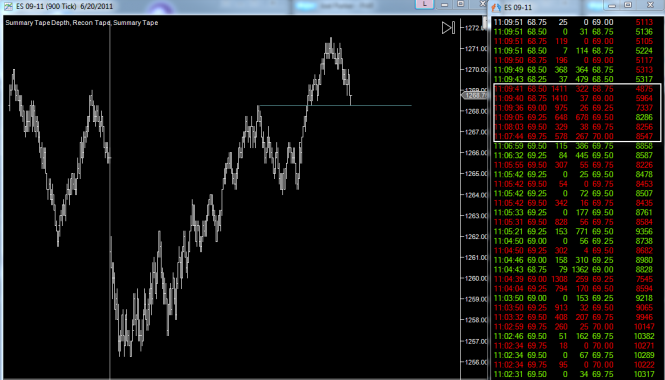
For the ‘thicken up’ scenario, here is an example of what I like to see:
In this example, we can see that we have a line at 1268.25. This was the prior resistance and my expectation was that we could find support again in this area. This line was drawn in as we broke through the level. This is the area we are looking for confirmation. As we came back down to the level, we can see that – 11:03:50 – 913 contracts to get down through 1269.25, 11:04:04 – 794 contracts to down get through 1269.25, 11:04:39 – 1308 contracts to get down through 1269.00, then from 11:07:44 – we saw 578, 329, 648, 975, 1410, 1411 contracts to successively tick down. At this point, you could have considered your line ‘confirmed’ and as it turns out the price did reverse from here. A few things to note though:
- When we see the market thicken up, don’t expect to be able to buy with a 1 tick stop. It doesn’t work like that. It benefits the market makers if the price comes down a little more so that they can buy more before pushing it up.
- You do not have to jump in immediately when you see this. Often the market will oscillate around 2 bid/offer levels for 20-30 seconds before making the move. I personally like to wait for this to happen before getting in. Sometimes it means I miss the trade but often it means I get a better entry price.
- Do not expect to hit your level to the tick. It’s more likely on the ES as the tick size is larger and it’s more liquid. On the CL/6E you should not expect ‘to the tick’ reversals.
- Do not simply try to replicate what I am doing. The idea here is to give you some pointers to help you apply this to your own trading. This lesson is not a full description of a trading method.
- Contact us if you want to chat about any of this.
Alerts
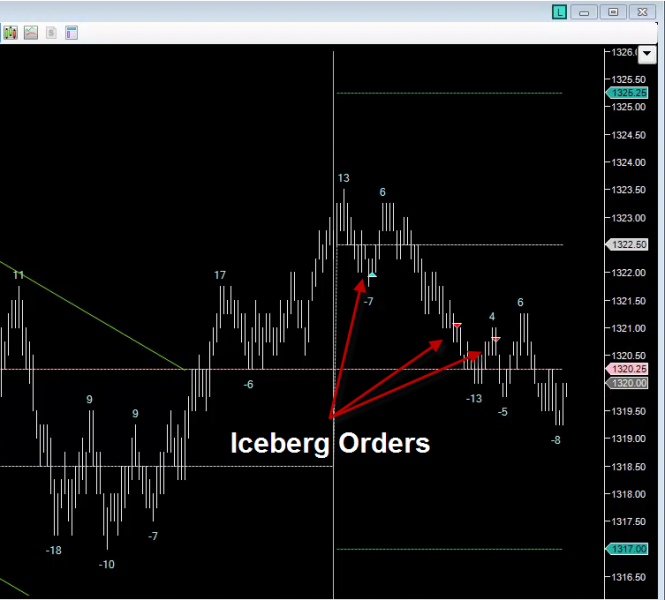
The Summary Tape has a number of alerts. These are not meant to be entry signals but obviously, you will see alerts trigger at key turning points. The image below shows the iceberg alerts. The blue triangle is an iceberg order on the bid (hence the market moved up from there short term), the red triangles represent iceberg orders on the offer.
Each alert exists for a very specific reason. I will explain them, most significant first.
Iceberg Alert – Iceberg orders are simply limit orders that get ‘topped up’ as market orders consume them. You may for instance see 500 limit orders on the inside bid. 100 market orders trade against that but you still see 500 limit orders there. When this happens, somebody is trying to buy contracts without it being too visible. They don’t want the order to be visible because they want people to continue selling to them. Often this happens when somebody is manipulating the market in the short term. If the market is powering down into an iceberg on the bid, then it might not necessarily turn at that point, it really depends on the intention of the buyer. On the other hand, if we are in an uptrend and we see a pullback, then an iceberg on the bid is quite likely to stop the pullback.
Large Qty Alert – This alert triggers if a large quantity trades at a level. This alert is somewhat counter-intuitive. If a large quantity trades at a bid level, that means there is a large quantity of market sell orders hitting that level. It also means that there is a bidder at that level that is willing to absorb the selling. For me, when I see these large volumes at a bid, I think of it as a bullish sign. When I see a lot of buying into an offer level, I see it as a bearish sign.
Price Delta Divergence Alert – This is a simple alert that tells us when either a) There are more market buy than market sell orders BUT price ticks down OR b) There are more market sell than market buy orders BUT price ticks up. We don’t show each time this occurs, we filter it by volume because it is most significant when a large quantity trades on one side price ticks in the opposite direction.
That’s the end of Lesson 5. Click Here to go back to the lesson plan.
Peter Davies
Copyright Jigsaw Trading © 2025
Privacy Policy
Futures and forex trading contains substantial risk and is not for every investor. An investor could potentially lose all or more than the initial investment. Risk capital is money that can be lost without jeopardizing ones’ financial security or life style. Only risk capital should be used for trading and only those with sufficient risk capital should consider trading. Past performance is not necessarily indicative of future results.
Testimonials appearing on this website may not be representative of other clients or customers and is not a guarantee of future performance or success.
Jigsaw Leaderboard
Note that the Jigsaw Leaderboard contains a mixture of SIM/Live Traders. For many traders, you can click by their name to see the trades along with the SIM/Live designation.
The following is a mandatory disclaimer for SIM Trading results:


