
Message from Paulo
I received this message from one of our customers and I thought it was worthy of putting in the free lesson section of the site. I’d given Paulo a trial of the products and asked for feedback. It’s actually 2 messages:
Message 1
As I told you, I am returning to you now after almost a week trading with your new indicators.
The same way you helped me with your work, I also feel myself with the duty to share something also the way I look the markets and how you helped me.
I used to trade in a strategy that consist in good trade location in a continuation or new trend market with a stop of maximum 6 ticks but I never understood the fundamental basis of this until I saw your work. First let me show you what I use to do and then what I can understand now reading your work.
My strategy is to make a check list of some things:
First – I try to read the swings of the market using tick charts. I have 6 charts open – 500, 1500, 4500, 13500 and 40500. I mainly focus on 1500 for daytrading but I use to see the other to have a better feel and to know the main pivots of long Term. I use them with Keltner Channel just to better visualize the move and the 500 tick chart to try to pinpoint the entries.
Second – I search for a bracket or acumulation in the direction of the trend or new trend
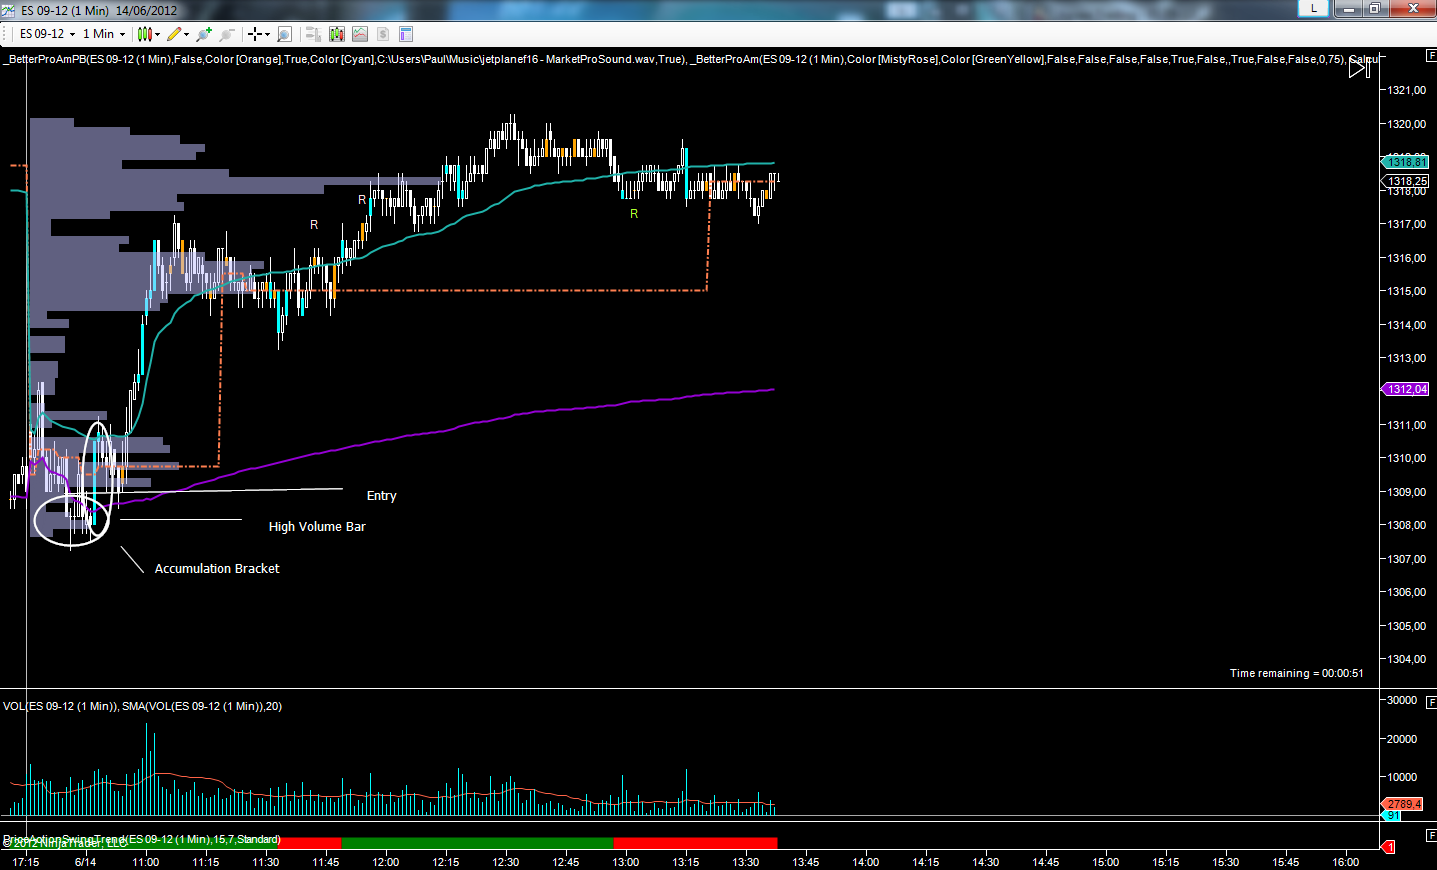
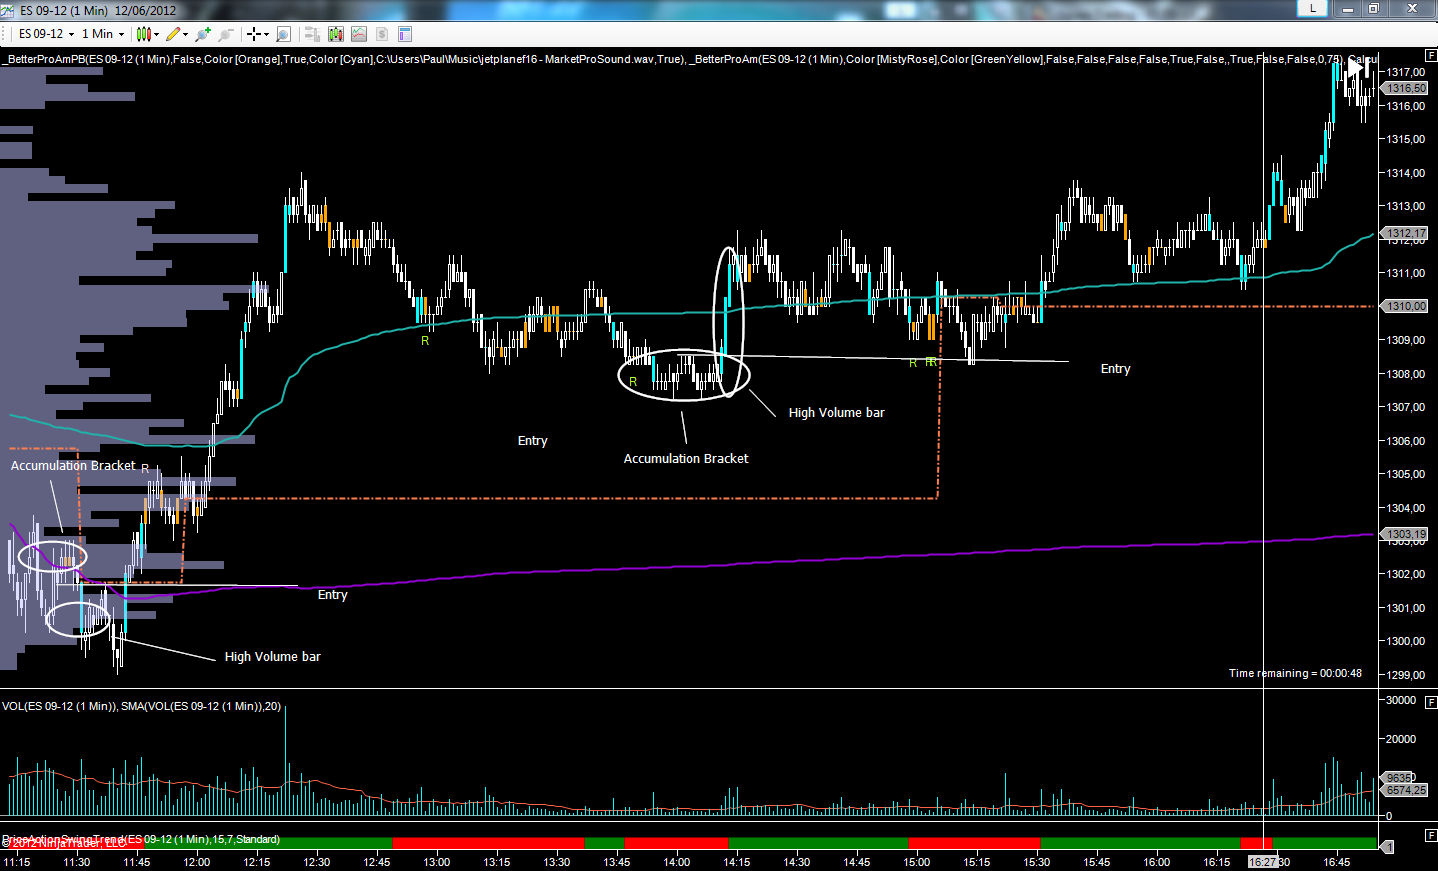
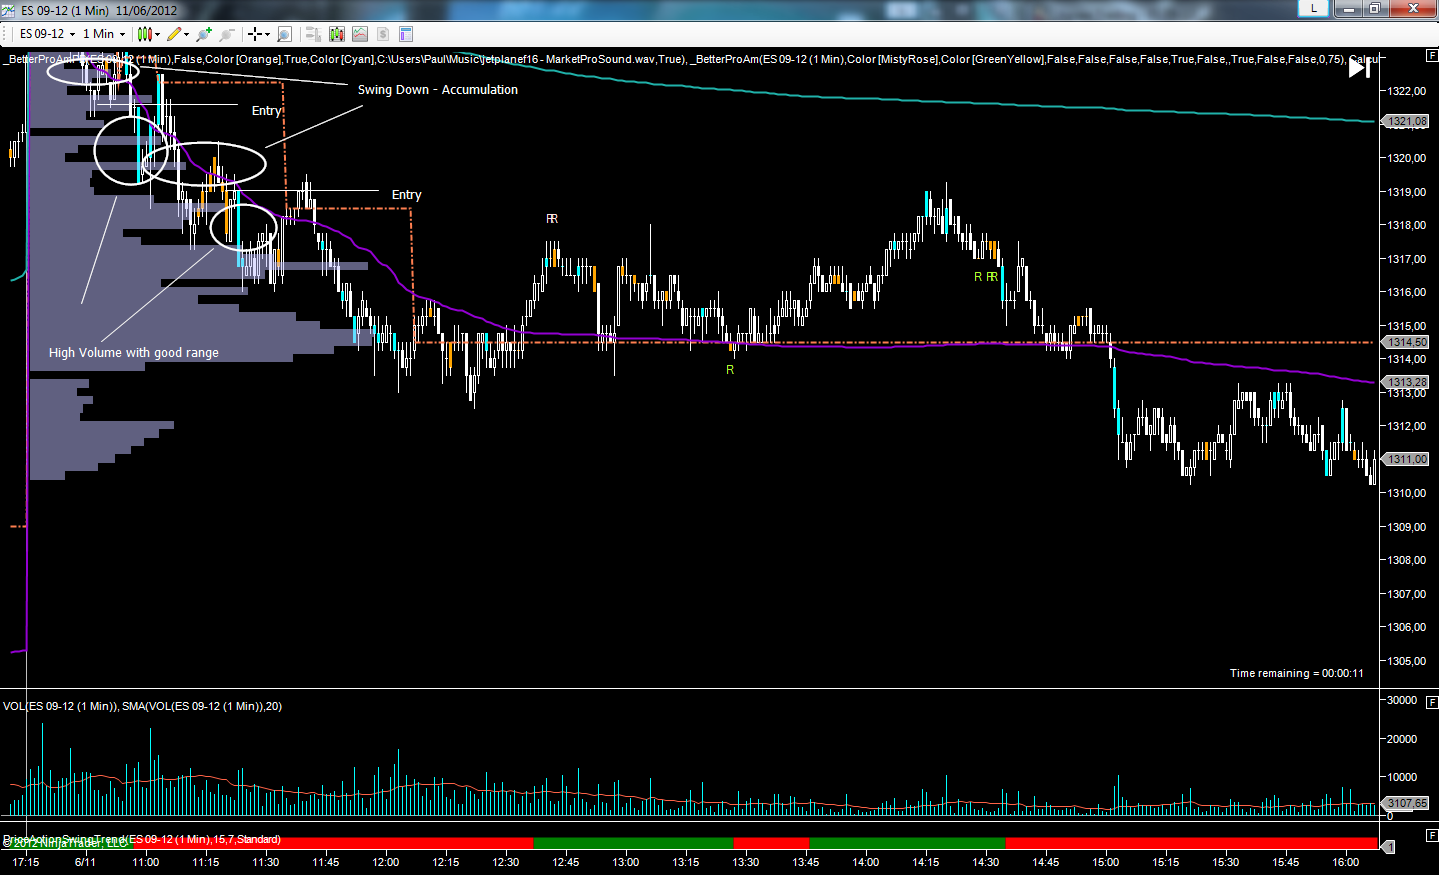
Third – I have an indicator here that I bought from Barry from DTTM that shows high volume bars. I search for this signal in a 1min chart. If this High volume bar is leaving a bracket or accumulation in the direction of the trend and has a decent range, I put my entry near the other extreme of the bar or the last mini resistence/support broken. The High volume bars are in Cyan.
My trades are in attached files.
First picture, on Jun-11, I went Short 1321.50 got 3pts and then 1319 and got 4pts.
Second picture, on Jun-12, I went short 1301.75, got stopped out -1,5pts. Went Long 1308.50, filled to the tick and stayed till the end of the session. 9.25pts
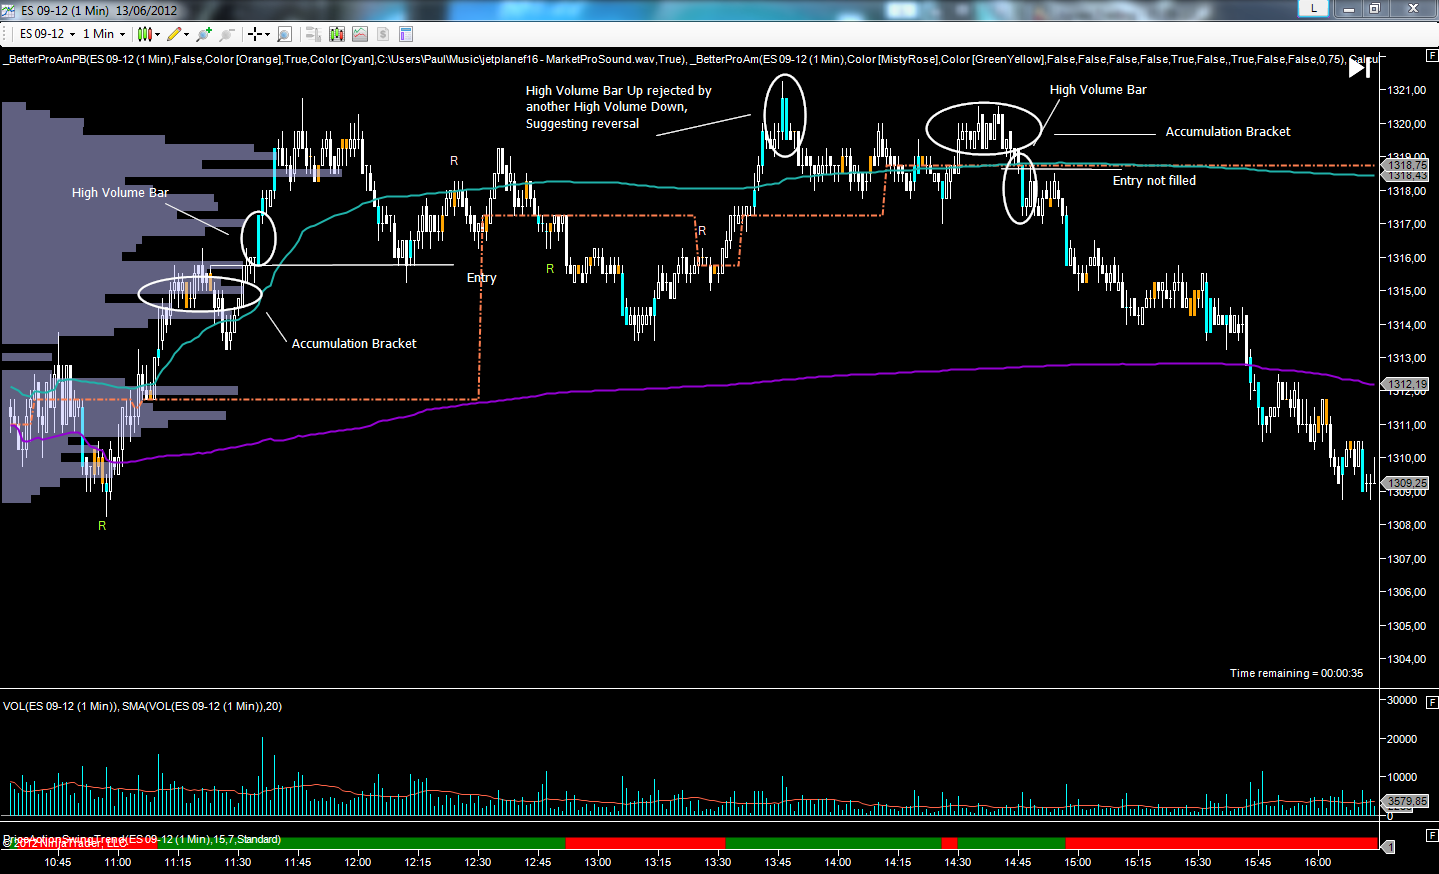
Third picture, on Jun-13, I went Long, got 3pts and try a Short not filled
Fourth picture, today, the best of all, went Long 1308.50 and got 10pts and have the rest of the day to play with my son.
In my theory if my entry fails more than 1,5pts it is not valid anymore. But I did not know why till I read your work.
This accuracy level raised after reading your work. I added the GomCD that I already had to one of my tick charts, but I never knew how to use it well and I realized that the market use to get this pullback to the beginning of the High Volume bar because of the vacuum liquidity you showed in your work. So, I became confident in pulling the trigger. Also it helped to filter some signals. So, the big boys enter and eat all the liquidity in one direction, making it move. The vaccuum of liquidity happens and then the markets pullback. That’s the entry. If it fails more than 1,5pts, as you say, I bail. If it begins to tell me it will stop me, I bail before the stop.
Actually I tried to do the Tape and DOM reading but I still can’t read it well. It seems still too fast to read without blowing out my mind. I added a footprint chart from Gomi also and I am working to try to read the DOM first through it. I’ll get there, but I need to study it more.
So, as I told you before, I think I will always be a student in trading. Hope you can be one of my teachers forever.
Message 2
After many years receiving so many trash information from the magic so called “guru’s”, I’m glad to help support your work and show you are serious about trading and helping people to achieve their goals. If I knew 5 years ago who are the serious and really professional trading educators guys, it would cut me a lot of time and saved me a lot of money.
Let me know when you put that, so I will visit it.
Coming back to the market, after I sent you the message, I turned off my computer and went play with my son. By the end of the day, after he sleeped, I opened my platform to make my journal and I saw what happened after I turned off my computer. It seems that somebody released some news 1 hour before the market close about Central banks going to help the markets and liquidity. And that made the market become more volatile and the volume peaked. I put my platform in replay mode and I saw how beautiful was the move. As I learned from you, what I see about what happened was again a huge vaccuum liquidity again. When the move started, it broke up a small bracket that had 1316 as resistance. The market went strong till it topped near 1327. That left the big vaccuum liquidity and the market returned to where it started to begin rising again. It seems that the market need to get back to “normal” before it continues in the direction of the sentiment that arrived. Again my strategy would work if I stick to it. I did not know why. Now I do.
End Message
The key here is that Paulo simply has a better understanding of how price moves. There’s no rocket science here. He won’t need a teacher forever as he can now build on those basics of price behavior.
It’s nice to hear messages like this. Thank you Paulo for the message and thank you for allowing me to share it.
Peter Davies
Copyright Jigsaw Trading © 2025
Privacy Policy
Futures and forex trading contains substantial risk and is not for every investor. An investor could potentially lose all or more than the initial investment. Risk capital is money that can be lost without jeopardizing ones’ financial security or life style. Only risk capital should be used for trading and only those with sufficient risk capital should consider trading. Past performance is not necessarily indicative of future results.
Testimonials appearing on this website may not be representative of other clients or customers and is not a guarantee of future performance or success.
Jigsaw Leaderboard
Note that the Jigsaw Leaderboard contains a mixture of SIM/Live Traders. For many traders, you can click by their name to see the trades along with the SIM/Live designation.
The following is a mandatory disclaimer for SIM Trading results: