
Simplify Your Trading
Jigsaw helps traders learn faster, trade smarter with simple, repeatable trading methods based on real-world professional Order Flow trading techniques.
Voted Best Software by Traders and Industry Professionals

Laszlo, Professional Proprietary Trader, Poland
I’ve been using Jigsaw for more than a year. It’s a fantastic product, it gives me an edge and it’s just getting better and better. I highly recommend it to anyone that wants a professional price ladder.

John Grady, Professional Trader, CEO “No BS DayTrading”
I think it is the best platform ‘hands-down’… you just see certain things in it that you don’t see in other platforms. It shows the ebb and flow of the volume very, very well. Customer service is excellent, any time you have a problem, they respond very quickly.

Louise
I am really happy with Jigsaw and have only had it a couple of weeks. Peter is also a great guy in explaining everything and the support has been excellent.
The daytradr trading platform can be connected directly to your favorite broker data feed or Trading Platform.
Connect Direct To Your Data Feed

Or Connect Via One of These Trading Platforms

- The Tradovate platform is also known as TSTrader over at Topstep Trader
- GAIN broker data is also known as: Alpha Trader, Apex Trader, ATC Trader, CTG Pro, DT Pro, G-Force Trader, Global Zen Trader, High Ground Trader, Index Trade Launcher, S5 Trader & Zaner 360. We support them all.
- More data feeds are available (e.g. Interactive Brokers, TD Ameritrade, eSignal) via our Platform partners. Contact us for more details.
- Independent – 10 hours of video for all customers, this is the most comprehensive Order Flow course available anywhere. Covers all of the theory of order flow and how to apply it.
- Professional – An additional 7 hours covering specialized topics such as Scalping, Volume Profile Analysis, Opening Trades and Trade Management.
- Institutional – A comprehensive course from our London Based Proprietary Trading Firm partner. Learn the same skills they teach their intern traders, with 19 setups along with the how to identify the market conditions each works best.
- Market Making – Ultra-Short term, higher frequency trading techniques from professional Market Maker Gary Norden. Gary was a senior trader at a number of Investment banks as well as being Head of LIFFE Options for UK Bank Natwest. This information is exclusive to Jigsaw, you will not find these techniques anywhere else.
Not sure which package is for you? Click Here for more information.
Jigsaw daytradr also has multiple layers of redundancy built in so that it’s always there when you need it and doesn’t fall behind in fast markets, like our competitors do.
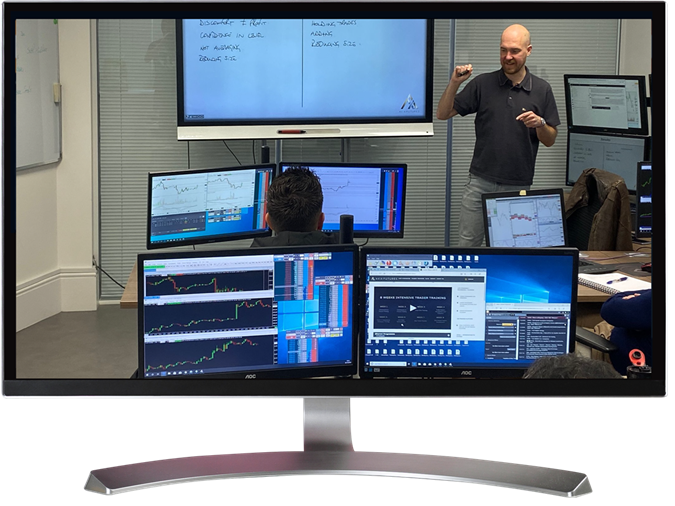
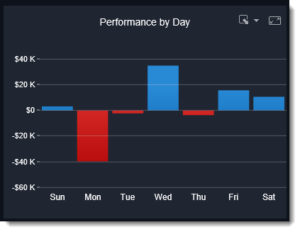
There is no trading technique you can learn today and profit from tomorrow. At Jigsaw, we recognize that trading is a skill and we give you the tools to develop your trading edge and iron out your problems. All customers get lifetime access to the basic version of our groundbreaking cloud-based trade analytics platform “Journalytix”. Your trade history is posted to a secure area on our servers automatically (no uploading required), where you can analyze the results to find patterns in your trading data you didn’t know existed. Not only will Journalytix help you find buried treasure in your trading data, it’ll help you iron out issues such as moving your stops and closing trades early.
For advanced users, Journalytix also has a real time audio market data feed, economic news calendar with 1 min and 5 minute warnings before a release, automated trade journal and numerous features to make it your essential personal Digital Trading Assistant.
The daytradr platform connects you to both Futures and Equities Markets.


- Additional Markets are supported via our Platform Partners, contact us for more details.
There’s no getting away from the fact that todays markets are news-driven. It’s news that brings volatility into the market. Even if you don’t trade the news, it pays to know if any new move under way is driven by news – either scheduled or just ‘out of the blue’. Jigsaw daytradr has a built in real-time audio news squawk and an economic release calendar that updates results in real-time. This leaves you well equipped to know when to stay out of the markets and when a new move is driven by something that is likely to be bringing institutional money into the markets.
News is fully customizable, you can select from resources such as Bloomberg, Reuters, Forbes, Zero Hedge etc. For the Economic Release calendar, we cover every country on the planet. For more on how this works, take a look at the video below:
Jigsaw tools are used by professional and retail day-traders.
23% Of our users trade Full Time.
A comprehensive package of education and tools for retail and professional traders. With a money-back guarantee! ****
Each Package Contains The Same Software but with Different Education Options. Click Here for More on Education.
INDEPENDENT
- Daytradr™ platform, One time payment **
- Complimentary - Journalytix™ trade history analysis
- Complimentary - Trade calendar & leaderboard
- Complimentary - Live chat room access
- Complimentary - Realistic trade simulator
- Complimentary - Supports demo/sim trading*
- Complimentary - Hands-on support
- Complimentary - Free basic training (click for info)
- Advanced order flow training pack (click for info)
- Institutional training – “trading with price and order flow strategies” (click for info)
- Monthly group therapy session – 12 sessions
PROFESSIONAL
- Daytradr™ platform, one time payment **
- Complimentary - Journalytix™ trade history analysis
- Complimentary -Trade calendar & leaderboard
- Complimentary -Live chat room access
- Complimentary -Realistic trade simulator
- Complimentary -Supports demo/sim trading*
- Complimentary -Hands-on support
- Complimentary - Free basic training (click for info)
- Complimentary -Advanced order flow training pack (click for info)
- Institutional training – “trading with price and order flow strategies” (click for info)
- Monthly group therapy session – 12 sessions
INSTITUTIONAL
- Daytradr™ platform, one time payment **
- Complimentary - Journalytix™ trade history analysis
- Complimentary - Trade calendar & leaderboard
- Complimentary - Live chat room access
- Complimentary - Realistic trade simulator
- Complimentary - Supports demo/sim trading*
- Complimentary - Hands-on support
- Complimentary - Basic training (click for info)
- Complimentary - Advanced order flow training pack (click for info)
- Institutional training – “trading with price and order flow strategies” (click for info)
- Complimentary - Monthly group therapy session – 12 sessions


- ** To use daytradr for Live Trading, a subscription is required. $500 Annually OR $50 Monthly.
- ** Compatibility: Jigsaw DAYTRADR™ works with CQG Continuum, Gain (OEC), IQFeed, Rithmic and Tradovate Data Feeds. It also plugs connects directly to NinjaTrader 8 and MetaTrader 5 Platforms.
- The Gain Feed is also known as (S5 Trader, Alpha Trader, Apex Trader, ATC Trader, CTG PRO, DT PRO, G-Force Trader, Global Zen Trader, High Ground Treader, Index Trade Launcher & Zaner 360)
- *** Compatibility: Jigsaw as a Plug-in, works with NinjaTrader 7 & MultiCharts.NET
- ****GUARANTEE: MONEY BACK GUARANTEE COVERS THE PRICE OF THE SOFTWARE ($579) AND NOT THE TRAINING (AS YOU CAN’T UNLEARN SOMETHING). JUST ASK ANY TIME WITHIN 14 DAYS OF PURCHASE TO GET THE REFUND.


Copyright Jigsaw Trading © 2024
Privacy Policy
Futures and forex trading contains substantial risk and is not for every investor. An investor could potentially lose all or more than the initial investment. Risk capital is money that can be lost without jeopardizing ones’ financial security or life style. Only risk capital should be used for trading and only those with sufficient risk capital should consider trading. Past performance is not necessarily indicative of future results.
Testimonials appearing on this website may not be representative of other clients or customers and is not a guarantee of future performance or success.
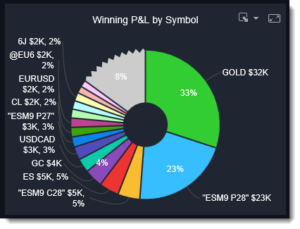
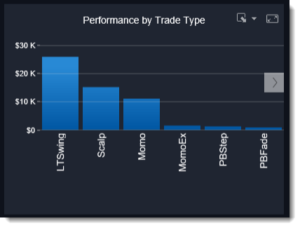
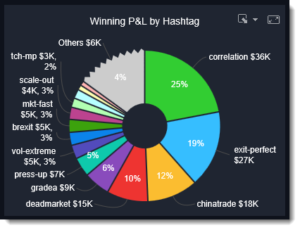
Jigsaw Leaderboard
Note that the Jigsaw Leaderboard contains a mixture of SIM/Live Traders. For many traders, you can click by their name to see the trades along with the SIM/Live designation.
The following is a mandatory disclaimer for SIM Trading results: