Lesson 11 – Now that you can read it…
This lesson is intended for those people that have spent a few weeks with the tools and might be feeling a little lost. At this point, you can actually read and absorb what the tools are showing but you might be struggling to use the information to make a trading decision. None of this is mandatory. Take from it what you will. Most of what is contained here is the result of discussions with full time traders I have met through Jigsaw.
Top Down or Bottom Up?
These tools work well as “the icing on the cake”. In other words, they can supplement your existing analysis techniques to confirm trade entries. In that case, you use some sort of ‘top down’ approach where the lowest level is your analysis of the order flow. Whilst this is perfectly reasonable, it might be the reason you are struggling to get any benefit from the tools. You are trying to do too many things at once. You are trying to do what you used to do AND trying to learn how to read the order flow at the same time.
A well-known UK Proprietary (prop) Trading Shop, takes on new traders and funds them. Their goal is to get the new traders trading 1-2 lots of the prop shops money within 12 weeks. Obviously some take longer. They do not allow their traders to use charts until they can trade off the order flow. It is not just this prop shop that is doing this. Through Jigsaw, I have met a number of professional traders who are all saying the same thing:
“If you want to use the order flow to help refine your entries, then learn to use it ON ITS OWN first.”
That means you sit down with your Order Flow tools – be it Depth & Sales or Summary Tape (or XTrader!) and you trade off them without charts. It’s OK to keep Reconstructed Tape to one side to show where the size is but that is all you should be using. Definitely no charts.
This doesn’t mean you will never be using other analysis techniques ever again. It just means you need to put them to one side in order to master the order flow.
For those of you that are struggling to find a way to analyze the markets longer term, this is actually good news. When you trade the order flow, you get multiple opportunities per day. You are watching an auction develop in front of your eyes. You are constantly evaluating and assessing the market. You will be getting feedback on your progress on a daily basis. If you look at the market in terms of what it does on a daily basis, then you will improve over weeks and months. It is naturally a slower process. If you looked at the market on a monthly basis, you would improve over years. If your methods of longer term analysis aren’t really working for you, then you can put that to one side, start making profits from shorter term trading and then start to attack the longer term analysis with a lot less pressure.
So how is this actually done? At the prop shops, they have a mentor that will set you exercises. Examples of the exercises are:
- Stay in the market all day. You cannot close trades, only reverse them. The idea of course is that you get in tune with the flow of the market.
- Scalp 2 ticks out of the market. Get in and get out after only 2 ticks. Do not hold on for more ticks. This will have you focused on entries.
They set high targets of 70+ trades per day. They have you do this on thin & thick markets. Personally, I’d prefer to stick with one market. You could set your own exercises based on the action. For example:
- Fade all iceberg orders/areas of absorption you see.
- Fade all iceberg orders/areas of absorption you see, if they fail to hold.
- Fade all iceberg orders/areas of absorption you see, if they fail to hold and then opposing market orders come in, in size.
- Look for pulling on one side & stacking on the other & trade that.
- Look for the market to establish a short term range and scalp either side.
- Enter a trade in a random direction and then try to ride the winners and cut short the losers.
- Wait for momentum in one direction and try to ride it.
The point here isn’t so much that these will be the way you will eventually trade, the point is to avoid that stuff on trading forums about “just watch the screen for 10,000 hours and you’ll get it”. Staring at a screen is dull, it is boring, it is hard to stay focused. On the other hand, exercises that get you involved with the market are fun and they are engaging. Having some structure to it as above is also useful as each exercise has you focused on different things and not just a random “punch buy or sell when you feel like it”.
Kam Dhadwar at L2ST recommends you go through this process by scalping in and out of the market with a small stop and target. That might be 4-6 ticks on the ES or 6-10 ticks on the CL. To me, this seems like an excellent idea. Again, he recommends that you develop the Order Book reading skill before you try to combine it with anything else. Sit down, focus on the Order Flow, and scalp in and out. Professional Traders are recommending this for a reason.
Finally, I think you have to be realistic about how much time you can focus on this per sitting. I recently took a lesson in a Boeing 737 flight simulator. It lasted an hour. At the end of it, they had to pry my fingers from the yoke. It was fun but took an incredible amount of focus because there was so much to do and it was all new to me. It was certainly stressful. Whilst it was fun, an hour was enough. I know the prop guys are made to sit down all day and trade this, I am sure they take breaks but given the choice, I’d much prefer to do 2 x 60 minute sessions initially per day than try to spend 8 hours on it. If you feel like it’s just not sinking in any more or that your focus has gone, take a break.
Choose your weapon
Different markets have different amount of liquidity and behave in different ways.
Thin – NQ, YM, TF, CL – These markets are very illiquid, there is plenty of trading. There’s just not that much resting liquidity in the form or limit orders on the DOM. They move around very quickly and there is a lot of action/activity. Exceptionally large bids/offers are easily visible on these markets and whilst they are significant, you can’t take a simplistic “see a large bid & buy” approach. These are not the sort of markets you can trade 100 lots but they do make larger moves.
Medium-Thick – ZC, ES, Bund – These markets are thicker. The quantity of limit orders on the DOM is much higher, yet they are still putting in good intraday moves. The exceptional quantities on the bid & offer are less visible here. Certainly on the ES, they are less visible/meaningful than ZC/Bund but the key to these markets is that they are thick, they can be traded with decent size and they still put in good moves.
Ultra-Thick – ZF, ZN, FESX – These markets are ultra-thick. There is a lot less movement intra-day and the opportunities to make (and lose) money are fewer. The treasuries in particular are slow and the manipulation is somewhat easier to see because of the time over which people build positions.
There are many markets and you will find that they change character somewhat from the Asian to the European to the US sessions. Different markets suit different people. To learn how to read order flow, you need to stick to one market initially but you do need to choose a market. My opinion is that the best way to do this is to set aside some ‘play time’, time where there is no pressure, where you are not planning to trade but where you spend some time looking at markets with different characteristics/flow. You might find that one particular market ‘clicks’ with you.
Reversals
A lot of people are getting caught out trading reversals or rather ‘trying to trade reversals’.
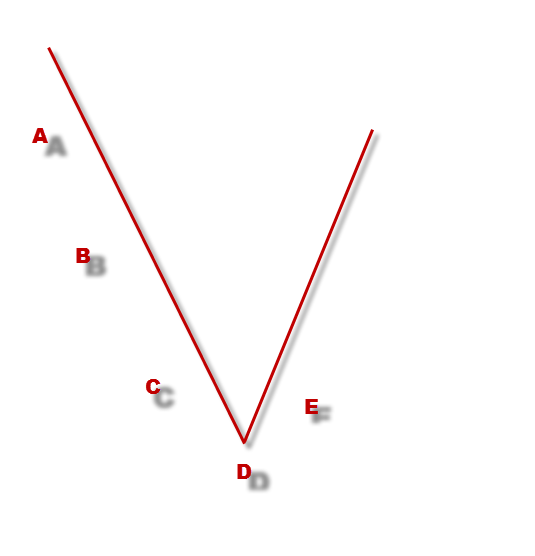
Here is a representation of a swing. Market moves down, market moves up. This could be the end of a trend or the end of a pullback:
What a lot of people focus on when reading order flow is on nailing point “D” and entering a long trade there. It certainly is possible to catch a reversal point like that (esp if it’s a reversal from a pullback) but don’t make that all you look for.
A->C – When a market is putting in a sustained move, it has a certain appearance on the Order Flow. In this case it’s a down move and we’d define that appearance/behavior as Selling Pressure. If you focus on nailing “D” all the while, you may well find you keep jumping in front of selling pressure and getting run over. If you focus only on recognizing point “D”, you probably haven’t begun to learn how to recognise obvious buying & selling pressure. If you don’t look for it, you probably won’t see it. Spend some time focused on the DOM & learn to recognise those A->C moves.
When I started out looking at Order Flow, I would often see a market moving down, down, down, down. 1 tick, 5 ticks, 10 ticks, 15 ticks… and all the time I’d have my finger hovered over the buy button waiting for the opportunity to go long. Quite often, I’d go long and the market would run right over me. The thing is, if you see this type of action – SHORT IT. Don’t sit there for 20 minutes watching the market going down waiting for a long opportunity.
You’ll only be able to short these relatively easy to take opportunities if you look for the buying/selling pressure and go with it. You need to train your eyes to see it and see it early. Do not just spend time looking for point “D” reversals. It’s nice to catch the bottom of a swing to the tick but sometimes the easiest opportunity is in following momentum. If you spend all of your time looking for reversal points, the way buying/selling pressure builds will simply pass you by. Make a specific effort to look for it and be able to recognize it.
D – Point “D” can be someone holding the market, absorbing the sell market orders hitting the bid. It can be a lack of sellers – they simply stop selling there. It can also be a huge number of buyers jumping into the market. The problem with “D” is that the absorbing and lack of sellers happens a lot on the way down and then people just hit into the bids again. If you go by that alone, you are going to go through a lot of pain in the learning process. That sort of trade needs 1 or 2 other reasons to take it in my opinion (such as being the end of a measured move). The other thing about point “D” is that often you just get a huge amount of traders coming in the opposite direction. It happens that fast that the market has run up 3 or 4 ticks in seconds. So what do you do now, just ignore it because it’s not an optimal entry? The point “D” trades will be easier to take over time. Some are impossible to hit unless you have a limit order there ahead of time. Think of these trades as ‘advanced’ use of the order flow.
E – A lot of people call this entry a non-optimal long entry. The people that talk about Wholesale vs Retail prices would say it’s terrible because you are paying retail prices. If you think about it – you should already know what you are going to see at point E. You’ll have seen the “hold” at point “D”and then you’ll see buyers jump in and push price up AFTER the hold. You have 2 signs off the DOM then – the hold and subsequent buying pressure.
So – how will you know buyers have jumped in? How will you know it’s real buying pressure this time? Well – you’ll never know for certain but I’m pretty sure your ability to spot A-C type moves will come in handy. In effect, you give up a few ticks for confirmation.
If you have access to the FT71 webinars, take a look at the discussions on “Price Risk vs Information Risk“.
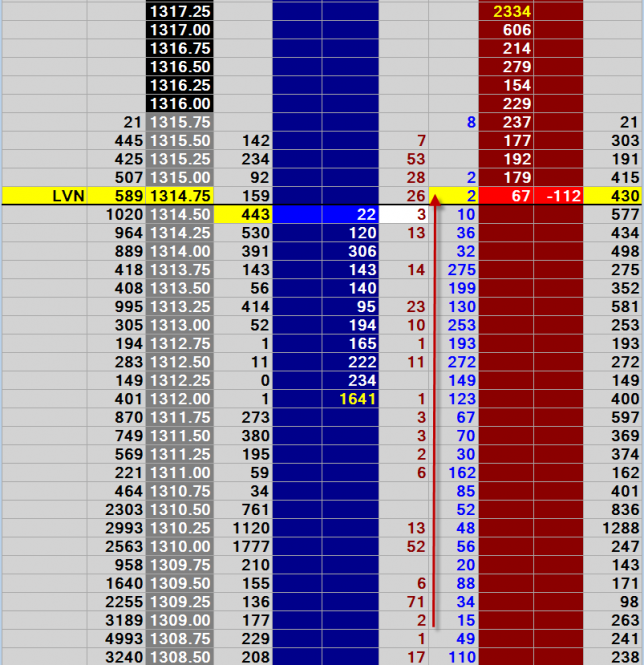
What exactly does this ‘buying pressure/selling pressure’ look like? Do not expect only ticks down when there is selling pressure. It will tick back, especially as this sort of move leaves ‘liquidity vacuums’ in its wake. Interestingly, these brief moves back create a nice visual representation on the Depth & Sales. As below, you see size on the trades at offer and gaps on the trades at bid. These gaps are partly because there are areas where little trading took place and partly because it ticked back momentarily, cleared the ‘trades at bid’ and then carried back up.
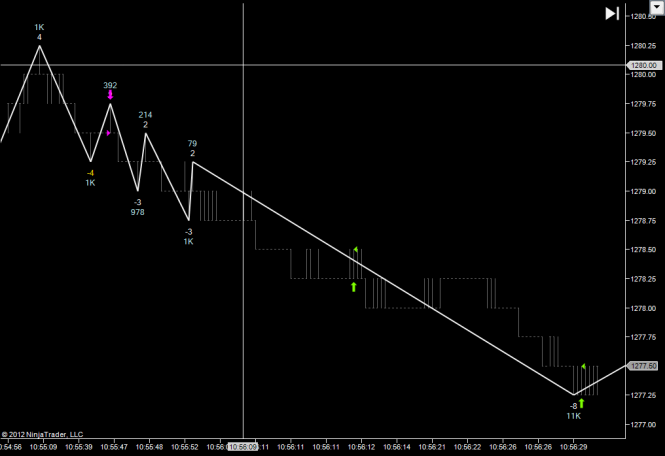
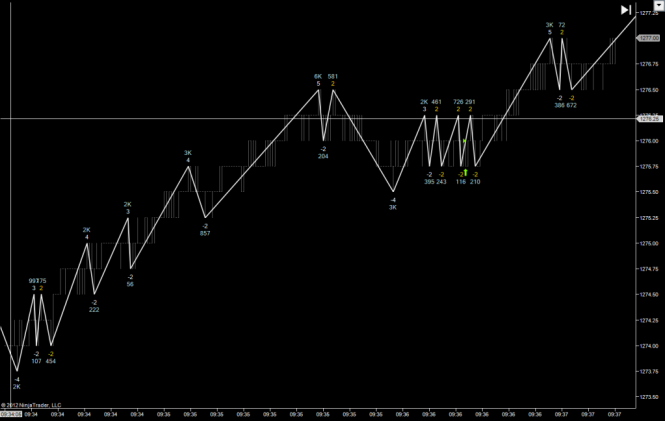
To give you an idea of how the market ‘flows’ in these periods of buying/selling pressure, here are 2 charts. Note that the white numbers represent number of ticks in the swing and the light blue numbers represent number of contracts traded in the swing.
In both cases, we can see how the market makes it’s move, the pullbacks are tiny and there is relatively little participation in them. The market ‘wiggles’ it’s way up and down but it does it with force and it happens quickly. Each market will be slightly different but the concept is similar. Note that these charts are just for illustration, don’t try to pull up a chart like this and trade it. It is just there to give you an idea of the action. As you learn to recognize this action, you will find that over time, you will be begin to anticipate this sort of move building up.
Summary Tape as a ‘tuning’ tool
The Summary Tape has a number of alerts on them. These alerts tell you about some of the most significant order flow events. Every market is different and these events have different significance in different markets. I personally would not use an alert as an entry signal. Alerts must be used in context. With any specific market, the alerts can be used to help you ‘tune in’ to that market. My suggestion to use Summary Tape to tune in is as follows:
- Switch on the chart markers for all three alerts but keep the sound off.
- Set the thresholds for the alerts quite low (so that you get more alerts).
- Leave this running all day and at the end of the day review the chart markers.
- If you see the alerts in random places, where they had little significance or if there are too many alerts, put the thresholds up and run again the next day with those numbers.
- Repeat until you either find the alerts are of no use or when you see them occurring in significant areas of action.
An example of this might be that you see icebergs against a trend fairly insignificant but icebergs with a trend, ending a pullback more significant. You might see that large size comes in at the end of a trend.
This helps you to find things to look for when you watch the order flow. Markets do change as they become more/less volatile but once you tune into a market, you will find that you are able to keep up with these changes as they tend to happen over a period of time, rather than immediately.
Bonus – L2ST Trading with the DOM/Crude Scalping Video
Kam Dhadwar at L2ST is primarily a swing day trader who uses Order Flow to refine entries. He has kindly allowed me to post up one of the videos from his customer-only site. In this video, he discusses various aspects of reading the Order Book and he discusses a method used to scalp thin markets, in this case the CL.Whatever markets you are looking at, it’s worth a look at this video.
Note that in this video, he is not using the Jigsaw Tools. The video was made long before Kam and I met. It is the concepts that are key here, more than any specific tools used.
You can find out more about Kam and L2ST here – L2ST
Just remember – don’t try and run before you can walk!
Changing Strategy
The chances are, whenever you try something new at trading, you won’t be very good at it. You have to practice. I am sure Kams video has drummed that into you but this is essential. If you can’t commit to something, if you keep looking for something new, you will never get anywhere. If you catch yourself going back to Google and searching for the next big thing just remember, all you are doing is pushing your progress backwards, not forwards.
Best of luck.
Peter Davies
Copyright Jigsaw Trading © 2024
Privacy Policy
Futures and forex trading contains substantial risk and is not for every investor. An investor could potentially lose all or more than the initial investment. Risk capital is money that can be lost without jeopardizing ones’ financial security or life style. Only risk capital should be used for trading and only those with sufficient risk capital should consider trading. Past performance is not necessarily indicative of future results.
Testimonials appearing on this website may not be representative of other clients or customers and is not a guarantee of future performance or success.
Jigsaw Leaderboard
Note that the Jigsaw Leaderboard contains a mixture of SIM/Live Traders. For many traders, you can click by their name to see the trades along with the SIM/Live designation.
The following is a mandatory disclaimer for SIM Trading results:


